Piezoresponse Force Microscopy (PFM)
Multiferroic materials have attracted significant attention recently due to their possible applications as magnetoelectronic devices, such as electrically tuneable spin valves or tunnel magnetoresistance sensors (TMR). Especially thin films of multiferroics in composite devices are of interest as electrically tuneable tunnel barriers and in potential storage applications. Due to their natural domain sizes, it is important to understand their behavior at the nanoscale.
In the family of multiferroic materials, magnetoelectric materials exhibiting ferroelectricity and ferromagnetism simultaneously are the most interesting ones. These materials can be characterized using Piezoresponse Force Microscopy (PFM), a variant of contact mode AFM. Typically, an AC voltage is applied to the tip and the resulting nanoscale deformation is measured. This deformation stems from the strain generated by the application of an external electric field (inverse piezoelectric effect). When analyzing the magnetic field and temperature dependence of the sample, further material properties and phase transitions can be recorded and analyzed.
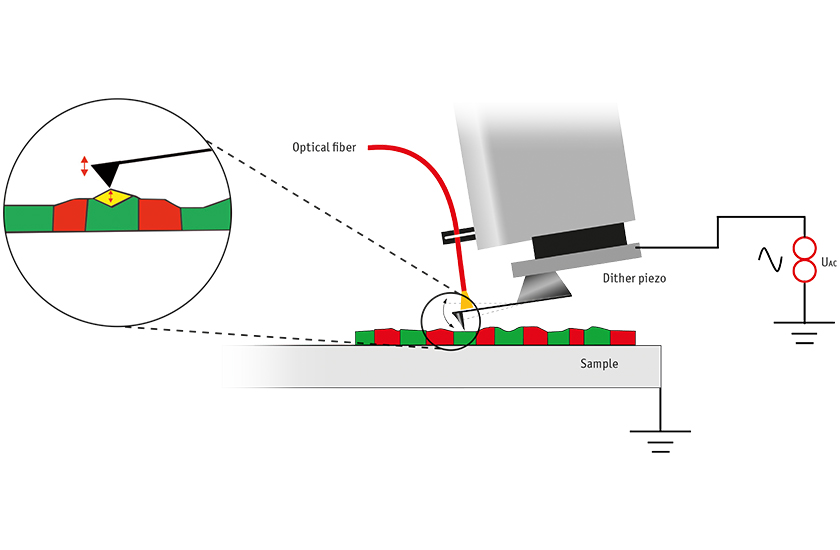
For performing a PFM measurement, a conductive AFM tip is brought in contact with the sample surface.
Once in contact, an AC voltage is applied to the tip resulting in a local electric field. Due to the inverse piezoelectric effect this results in a small local deformation of the sample, which is then picked up by the cantilever. A lock-in amplifier analyzes the signal and returns amplitude and phase information as a function of the sample position.
It is important to mention that due to the fiber-based interferometer for deflection detection in the attoAFM I, out-of-plane polarization of piezoelectric domains can be directly visualized with picometer precision. In-plane domains are only accessible indirectly via crosstalk effects. One advantage of the interferometer of the AFM is that it yields directly an absolute length calibration of the PFM response amplitudes, and hence enables quantitative analysis.
While the tip has a natural resonance with a rather high Q, the coupled resonance of the tip-sample system lies at much higher frequencies (~factor 5), with considerably lower Q factor. The resonance also depends on the local structure of the sample, hence making it difficult to track the resonance during scanning. Off-resonance techniques are therefore widely used and accepted in the community.

