
Software WAVE
streaming function and data processing
With the 'WAVE' software tool for measurement processing, attocube offers an extensive software package for a broad variety of features: e.g. configuring the interferometer device, displaying and saving measurement data, calculations based on measurement signals, or a real-time Fast-Fourier Transformation. The software packages WAVE and the WAVE Features 'Math' and 'Vibro' are optionally available for all IDS devices.
- Stopping and continuing data displaying
WAVE includes a function that stops the current displacements display to enable users to zoom into past data. The FFT plot automatically adapts to the zoomed time period.
- Time and displacement zoom: analyzing while measuring
The streaming function facilitates users to zoom into past measurements for a more detailed investigation of the captured motions.
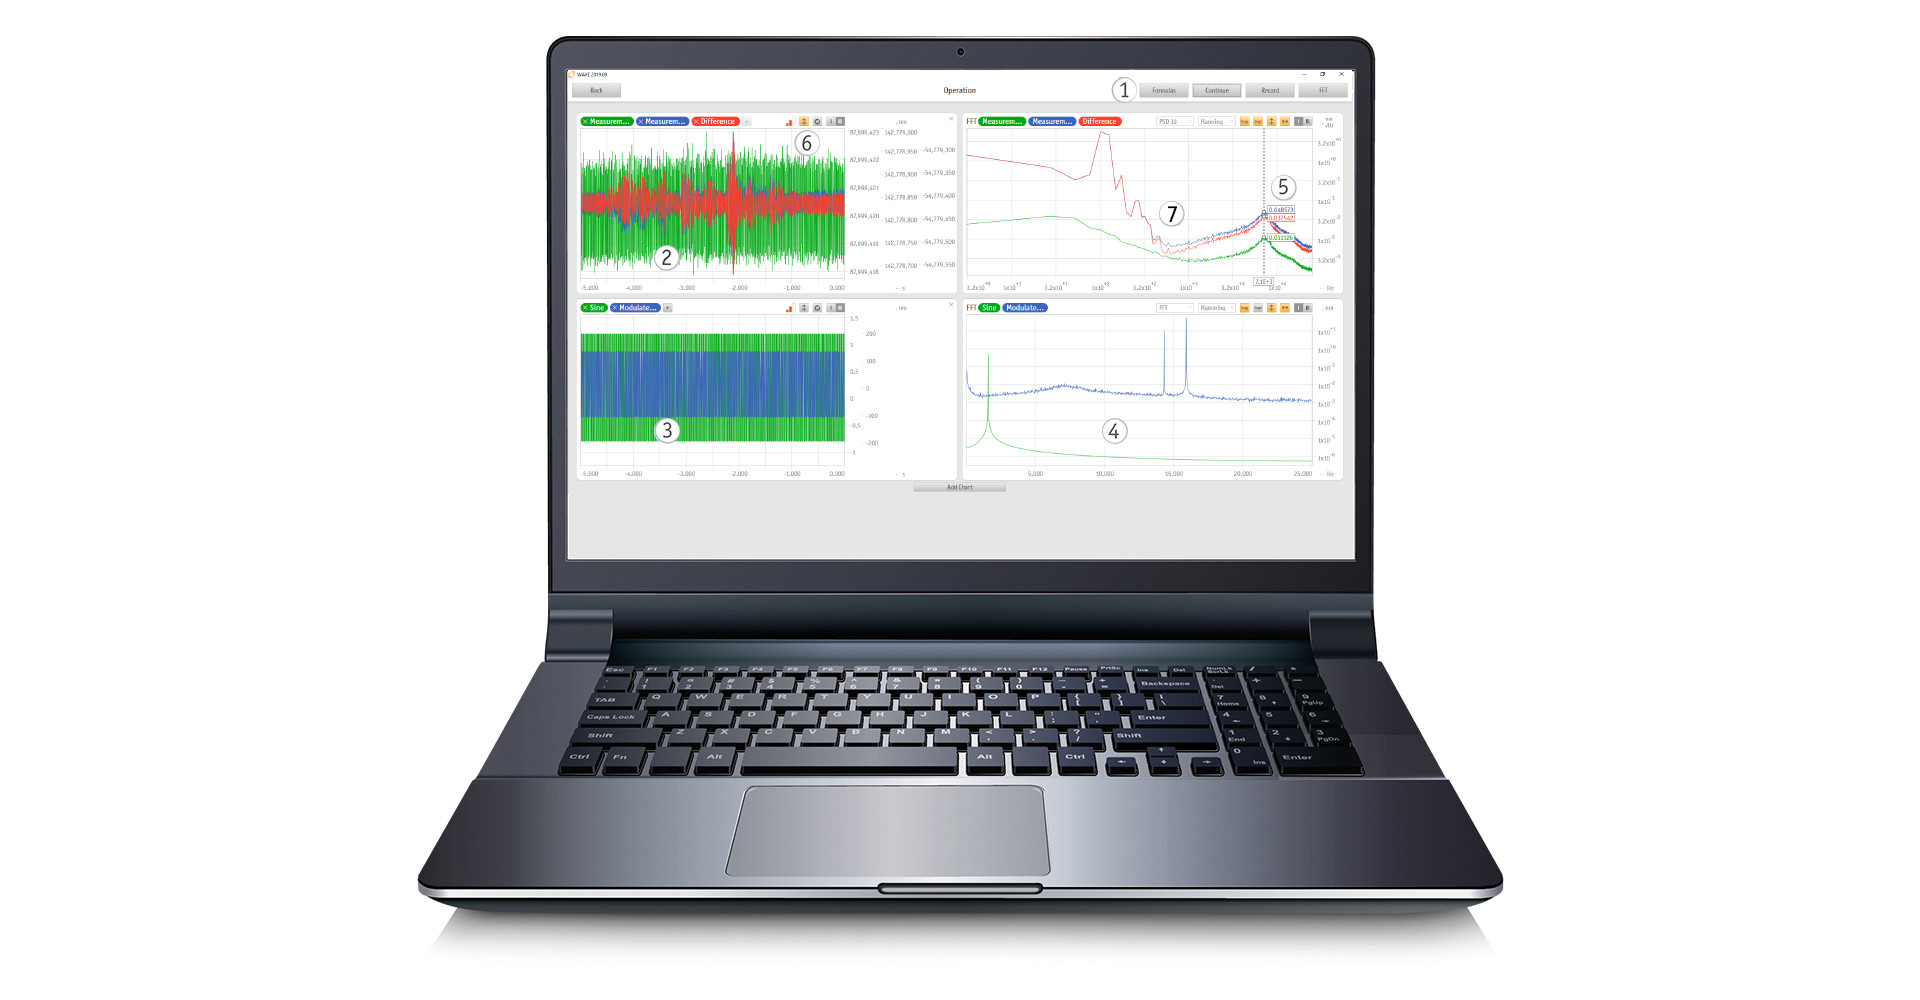
- Displacement data visualization: time-saving measurements
The window shows displacement data of the last 60 seconds at a low streaming rate of 1 kHz. For measurements requiring a higher bandwidth, like vibration analyses, the window can display data of the last 5 seconds at a streaming rate of 1 MHz (for one axis)
-
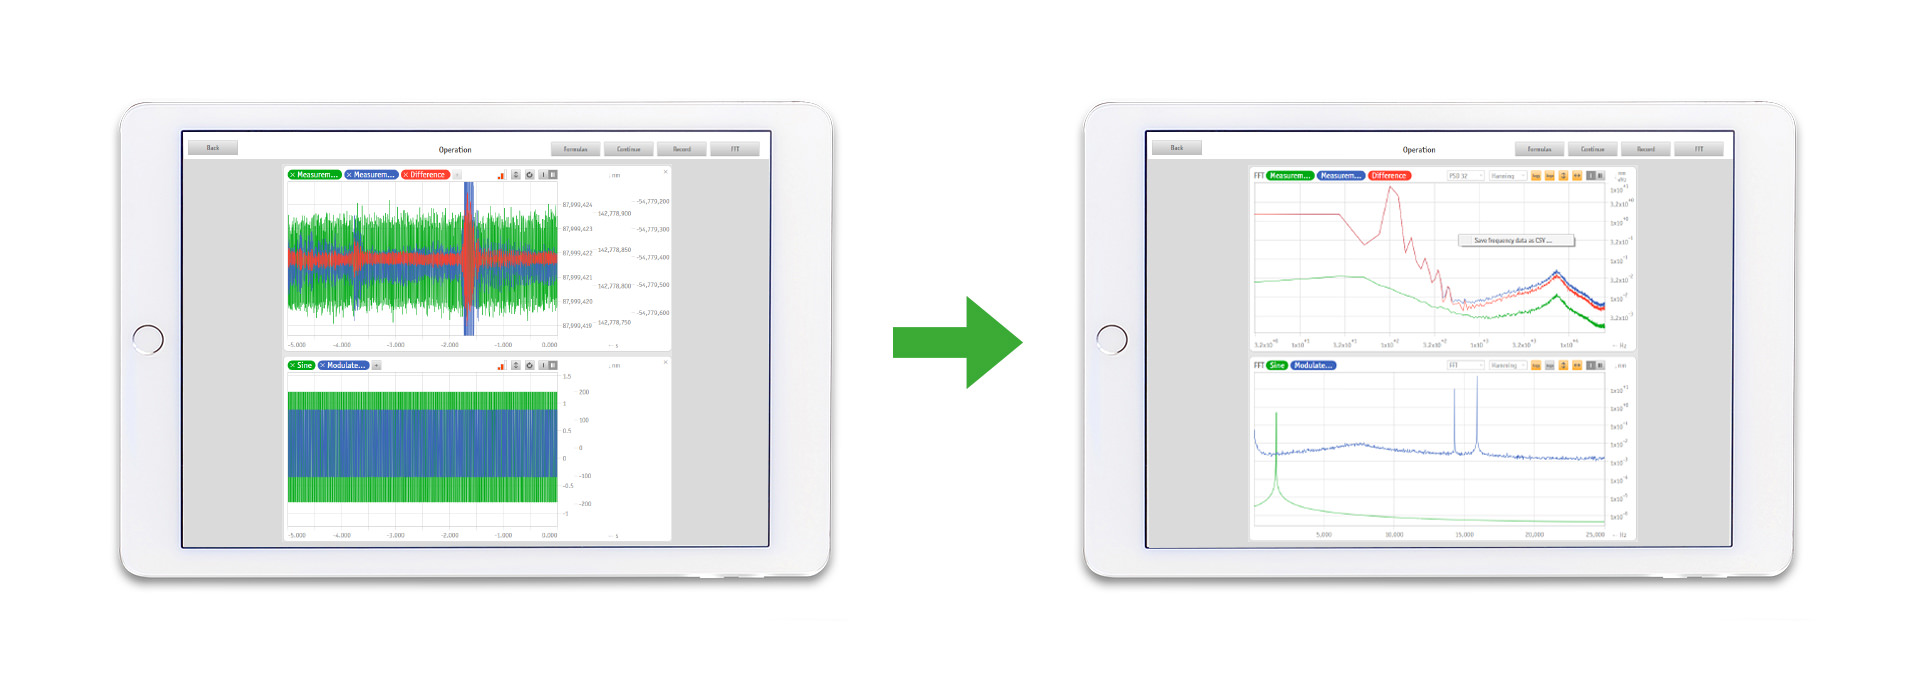
FFT Analysis: analyzing vibrations and overshoots
The real-time Fast-Fourier Transformation (FFT) enables frequency analyses of displacement data that are used for detecting the resonance frequency of components or for analyzing the spreading of mechanical oscillations.
- Data cursor and saving in pause mode
During the Pause mode, moving the mouse over the plot will show the measurement values. It is possible to directly save the marked measurement data as a .csv-file during the pause mode
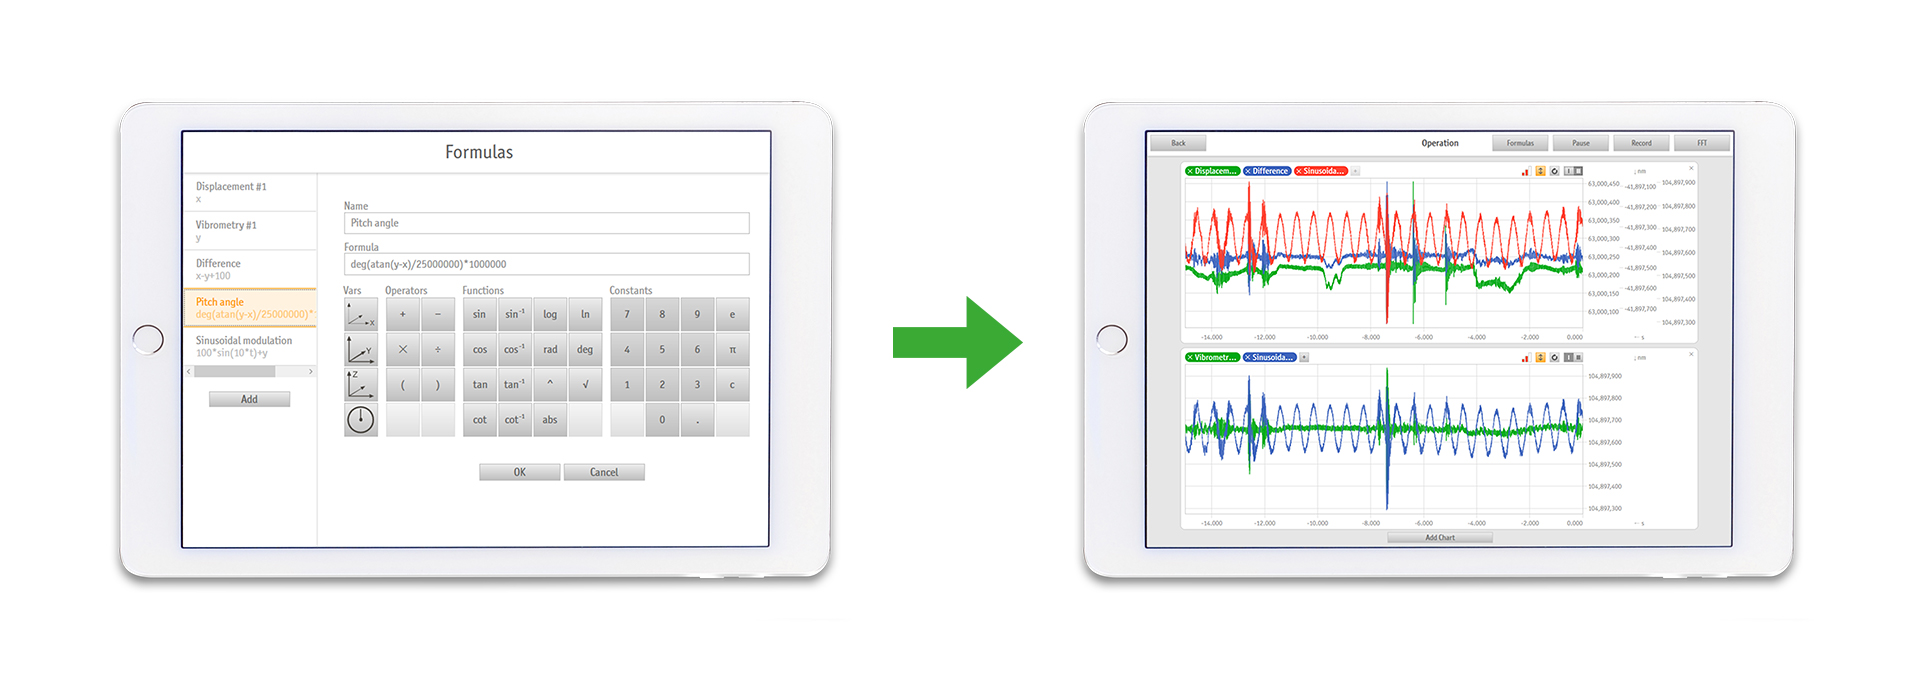
- Optional: manually defined formulas
The optional available WAVE Feature Math allows for live computing and displaying the measurement signals. This enables to show more complex measurement data, e.g. differential measurements or angular measurements.
-
Optional: Advanced vibration analysis
The optional available WAVE Feature Vibro allows for changing window functions of the FFT and visualizing the signals as a power spectral density chart - even with logarithm axes.
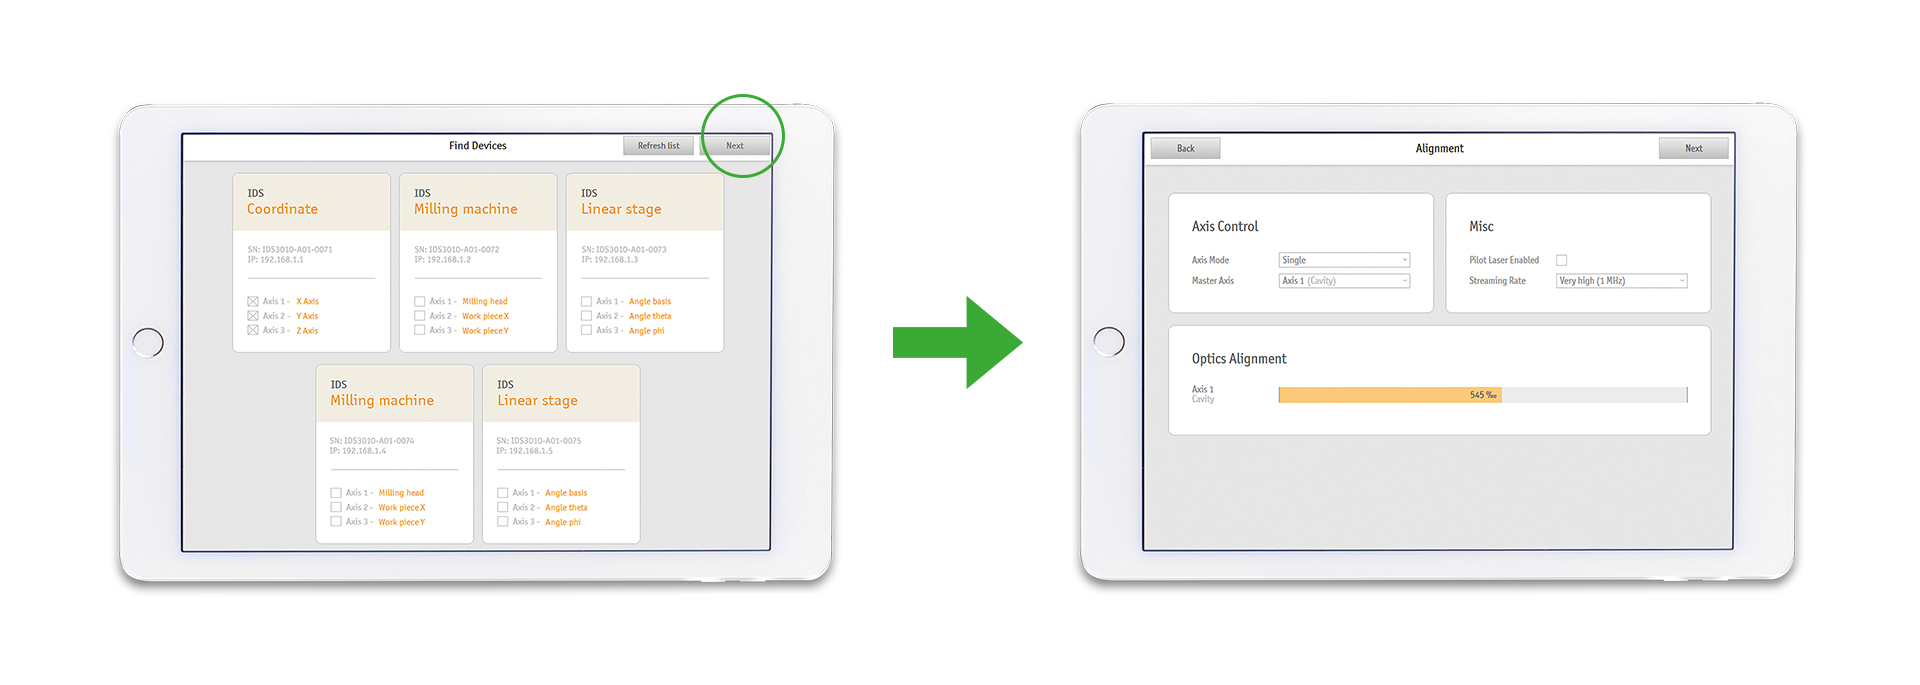
Device overview and alignment
The software tool WAVE displays all IDS devices that are connected to the computer (directly or via network). Furthermore, the alignment routine is also included.
Optional: WAVE Math for mathmatical operators and functions
The WAVE Feature Math allows for defining specific formulas for the measurement signals using operators (+,-,x,÷), trigonometric or logarithmic functions . This facilitates to visualize differential displacements/vibrations or changes of tip-/tilt angles.
Optional: WAVE Vibro for live vibration analysis and visualization
The WAVE Feature Vibro allows for changing window functions of the FFT and visualizing the signals as a power spectral density chart - even with logarithm axes. In pause mode, the FFT/PSD-data can be directly exported into a csv-file. These functions reduce the time for post-processing vibration data.
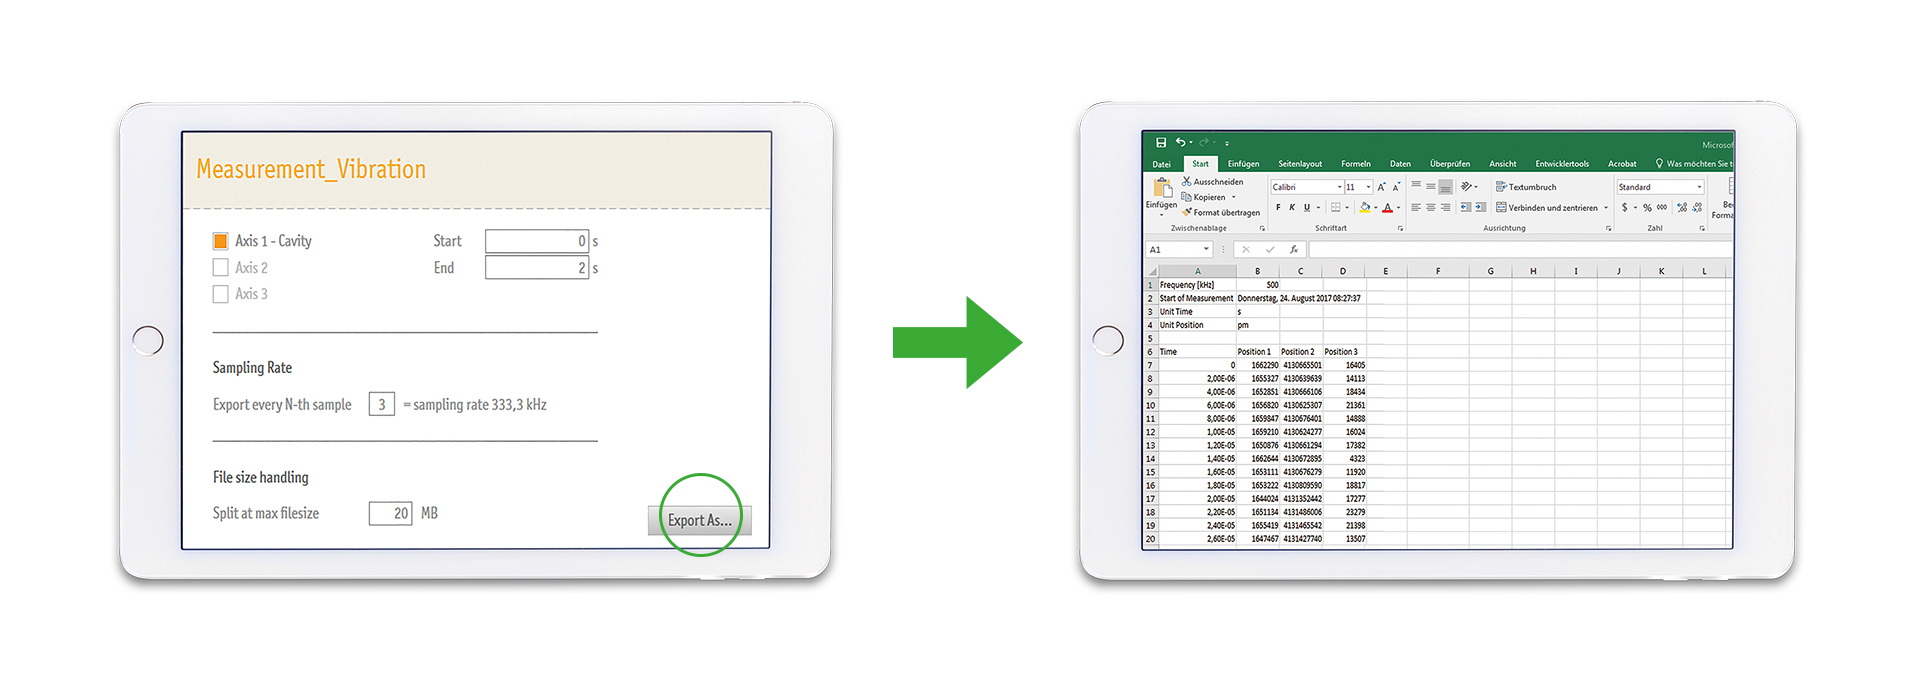
CSV-Export: Easy data post-processing
For a further post-processing of measurement data, WAVE enables to export measurement data to CSV-files for software tools like Microsoft Excel, Matlab, or Origin.