
Wide-field microscopy with
the attoDRY800 optical cryostat
Luca Gragnaniello, Samarth Vadia, Khaled Karraï
attocube systems AG, Munich, Germany
(Cooling) Power is nothing without control
The study of a physical sample as a function of a range of parameters requires full control on all the measurement conditions. In other words, one needs to be sure of being able to change only one parameter at once, to estimate correctly its impact on the system. When dealing with optical microscopy at low temperature, the most obvious pre-requisite for such a type of experiment is the spatial stability: scarce optical signal such as those from single photon sources often implies long acquisition times, and hence requires conditions as stable as possible over extended measurement period. Temperature fluctuations and gradients, as well as mechanical vibrations due to cold head, can jeopardize the acquisition of images over longer period of time and range of temperature.
The LT-APO (low temperature compatible apochromatic objective) configuration of the attoDRY800 optical cryostat has been expressly designed in order to optimize the stability performance. These particular objectives have been developed for the use at low temperature and in vacuum. Therefore, the LT-APO can be mounted directly into the cryogenic space and thermally coupled with the cold plate of the cryostat. As we will show in this report, this minimizes thermal drifts significantly compared to non-thermalized optics such as the one placed outside the cryostat.
LT-APO configuration: The Cryo-Objective
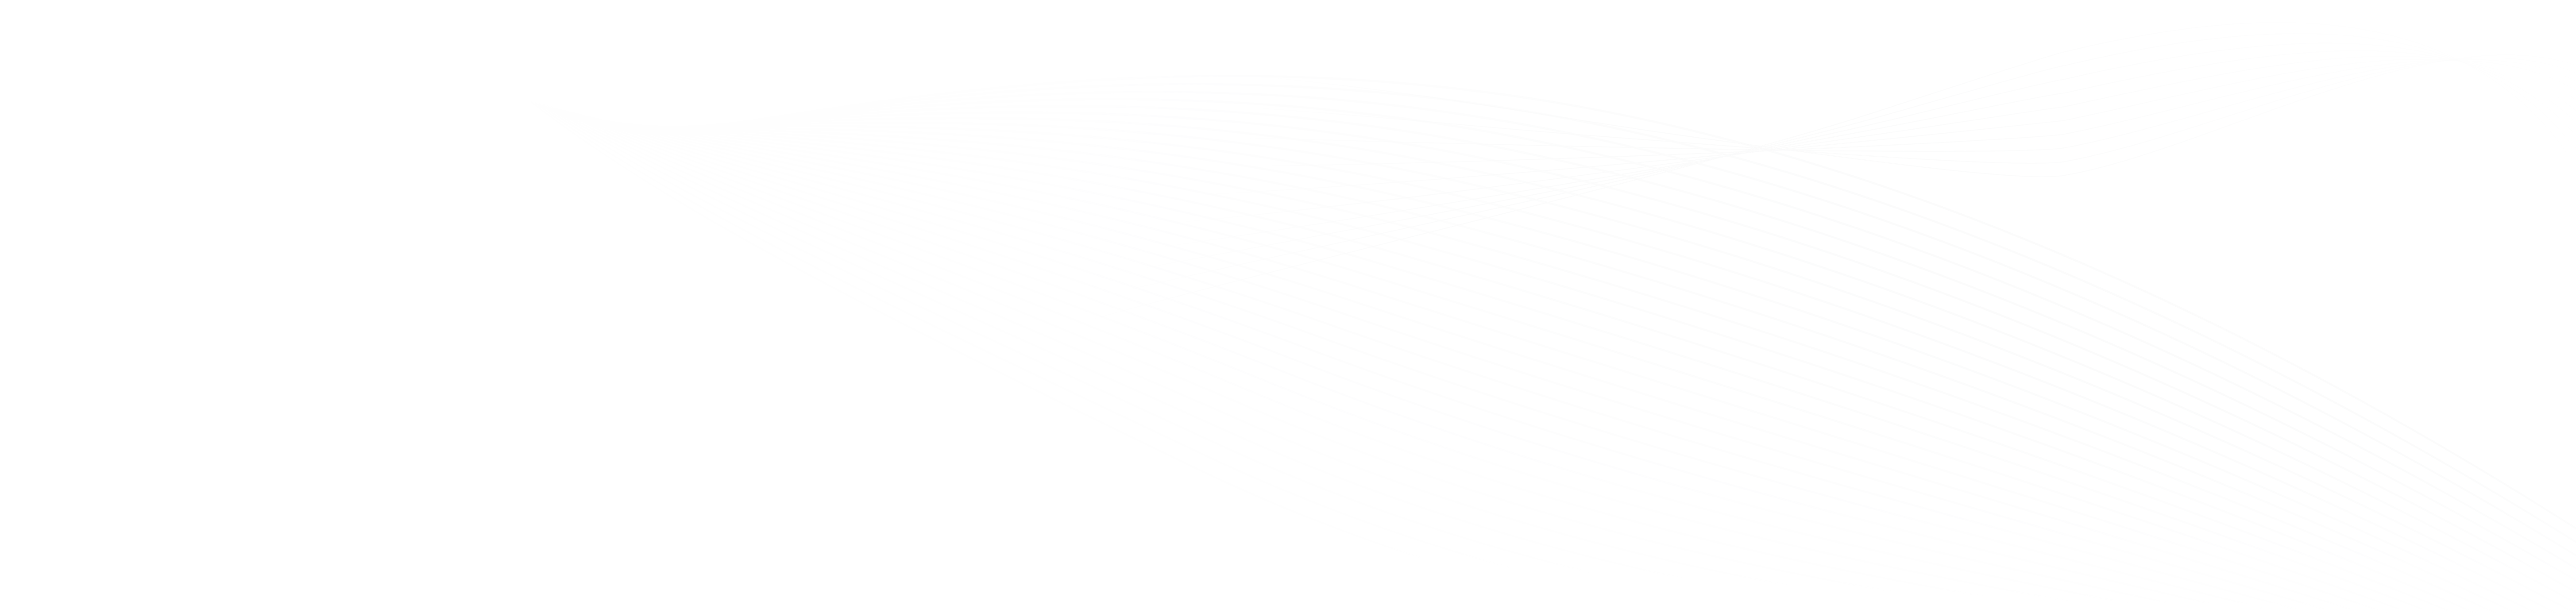
A schematic of the LT-APO configuration for attoDRY800 optical cryostat is shown in Fig. 1.
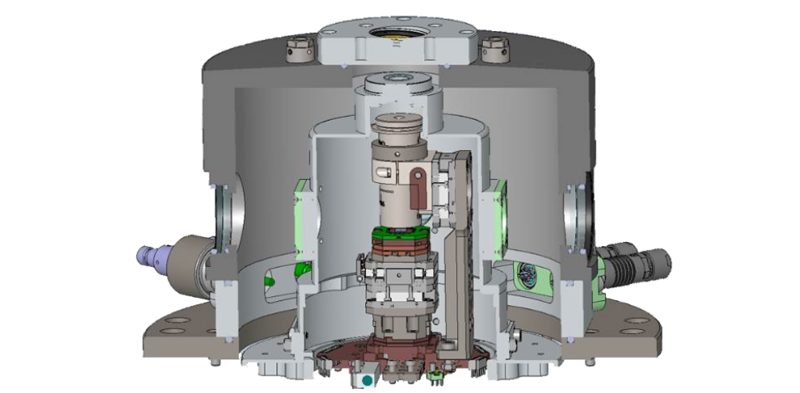
Figure 1: Schematic of attoDRY800 in LT-APO configuration.
The LT-APO/VISIR objective (NA = 0.82, WD = 0.65 mm [1]) is placed inside the thermally shielded cryogenic space and anchored at the cold plate, just like the sample. Its position with respect to the support is adjustable in a way that ensures that its position is reproducible after dismounting and remounting the setup. Precise focusing is provided by an ANPx311/HL positioner, which allows to move into the focus position.
The details of the LT-APO configuration is presented in Fig.2. It contains (a) a sample holder, (b) two ANPx311 positioners for motion in two lateral directions, (c) a spacer plate, which is optionally replaceable by an ANS scanner for high-precision scans, and (d) a thermal coupling link ATC100/70.
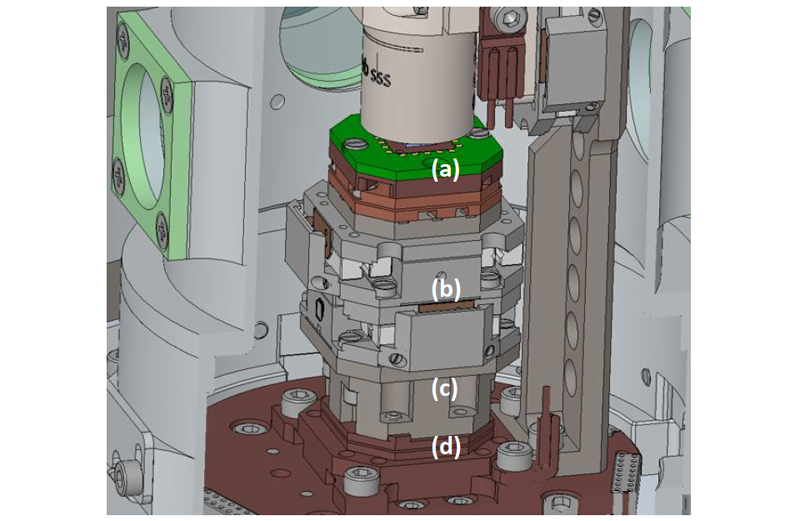
Figure 2: Details of the stack of the LT-APO configuration.
The standard sample holder is equipped with a temperature sensor and a resistive heater, and offers the opportunity to mount a PCB with 20 contacts.
Seeing is believing
In order to evaluate the optical performance, we assembled a wide-field white-illuminated microscope outside the optical cryostat, having its objective inside the cold chamber in LT-APO configuration. The resolution of our microscope is about 410 nm according to Rayleigh criterion and the camera image pixel corresponds to 53.5 nm on the sample plane. In order to obtain a direct visualization of the performance of our system, we used a resolution test target, kindly fabricated and provided by the Nanophotonics Group of Prof. Alexander Högele at the Ludwig-Maximilians University Munich, as our sample. The target is divided into 10 micro areas, each of them formed by horizontal and vertical stripes, a checkerboard and a size label, which are embossed on the surface. The micro areas correspond to calibrated patterns of the size range from 300 nm to 10 µm.
Find the difference
The traditional challenge with closed-cycle cryogenic systems have been: i) image blurring due to excess periodic vibrations and decrease in optical resolution, and ii) thermal drift over longer time period requiring frequent alignment of sample.
Here, we demonstrate that high-resolution images are completely unaffected by the operation of the cryo-cooler down to the diffraction-limit. The presence of clear scale references in the sample makes it extremely easy to verify the performance of our system. When talking about closed-cycle cryostats, users may be concerned that mechanical vibrations of the cold head can somehow affect the measurements. However, thanks to a proprietary design, mechanical vibrations inside attoDRY800 are extremely well decoupled from the measurement platform. To be convincing on this point, we temporarily replaced the LT-APO configuration with an objective with higher numerical aperture and even higher resolution. Although this objective is not cooled down like the LT-APO, it allowed us to verify that microscopy, even with higher spatial resolution, is not impacted by the operation of the cryo-cooler. The results of this test are presented in Fig. 3. The sequence shows images of the 400 nm object sized pattern: a full image is shown in (a), and magnified images, with cooler OFF and fully operative, are shown in (b) and (c), respectively. Upon comparing the acquired images, there are no measurable differences down to the pixel level between the images (ON vs OFF): a digital subtraction of the OFF from the ON image results in a featureless image to within the digital noise level of the camera’s 8-bit scale. Thus, we conclude that the use of the attoDRY800 with a diffraction limited high-resolution wide-field microscope is not influenced by the operation of the closed-cycle cryostat, at least down to the image pixel size. Therefore, this demonstrates the vibrational immunity of apparatus.
Figure 3: Sequence of images acquired with a wide-field microscope on the attoDRY800: 400 nm pattern (a) full image showing area (indicated by red square) used to demonstrate difference between cryostat (b) OFF and (c) ON.
Stability over time
To prove the long-term stability of the LT-APO configuration, we acquired an image of the 500 nm checkerboard at 3.9 K, as shown in Fig. 4 (top). In agreement with the theoretical resolution of 410 nm provided by our setup, the image clearly resolves the 500 nm dots of the checkerboard pattern.
Then, we let the system stay untouched for 41 hours and acquire an image later, which is shown in Fig. 4 (bottom). Remarkably, this image is identical to the one before! Let’s look at it in detail. First, it means that the LT-APO objective stayed in focus over days. This demonstrates that the stability in direction of the axis of the objective is better than the depth-of-field of the microscope objective over long period of time.
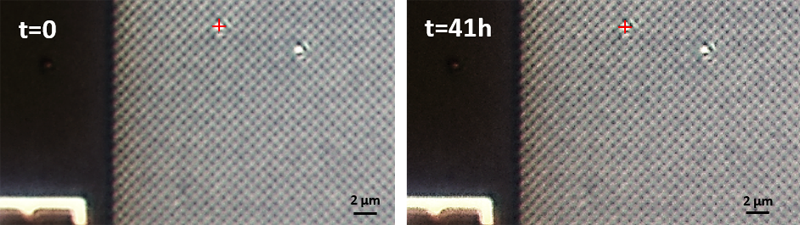
Figure 4: LT-APO image at 3.9 K of a 500 nm checkerboard pattern demonstrating time stability: top image acquired at t=0 and bottom image acquired in the very same conditions at t=41 hours without changing any measurement condition. The cross marker did not move within the resolution. Thus, we can remark a completely negligible drift of the image, i.e. less than one pixel size (53.5 nm).
Second, we quantify possible lateral drift. In order to measure it quantitatively, we evaluate the center more precisely, marked with red cross-hair.
By comparison of the two images, we can see that the microscope stayed centered precisely up to exact same pixel. Thus, we can conclude that the lateral drift at base temperature of the attoDRY800 in LT-APO configuration is at least lower than 53.5 nm i.e. one image pixel size. It is important to note here that this is not the case for a non-cooled objective configuration.
Lateral drift as a function of the temperature
A major feature of the attoDRY800 is the automated temperature control. This enables the user to perform measurements not only at 4 K but also up to room temperature in a controlled manner. In order to evaluate how the system responds to sample temperature changes, we used the resistive heater of the sample holder to heat the sample up, from base to room temperature. As reference for our acquisition, we considered the distance of the central pixel of the image with respect to a defect square of the 500 nm checkerboard pattern. Initially, we aligned the two reference elements, in order to define a zero position at base temperature. Then, we measured the drift as a function of the sample temperature.
Fig. 5 (a) shows the drift in two lateral directions as function of temperature. We performed a stepped warm-up procedure. For each temperature, we waited for the target to thermalize to the set value. Then, we acquired an image and measured the distance between the two references to calculate the drift.
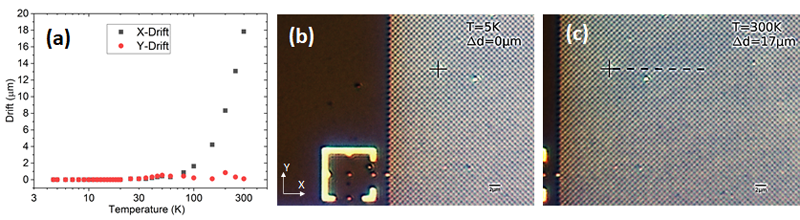
Figure 5: Lateral drift of target: (a) Drift in two lateral direction with respect to objective as function of temperature. Enlarged image of 500 nm checkerboard pattern at (b) 5 K and (c) 300K. The cross mark indicates the defect square, from which we measured the drift of the center of the image. The dashed line is between cross mark at 300K and center of the image.
Remarkably, from base temperature to 30 K the lateral drift is completely negligible, up to the limit of a single pixel size. This is achieved mostly thanks to the possibility to directly heat the sample, with the small resistive heater inside our sample holder, while keeping both the cold plate and the objective at low temperature. Another salient feature is that the objective stays constantly in focus, from base temperature to 50 K. Above 50 K, the objective was refocused at every temperature step. It is worth to remark here that the refocusing is a simple operation of linear translation by a specific ANPx311/HL positioner, independent of the sample position. Therefore, it is fast, reliable, and reproducible. However, one can observe that the drift gets significant at higher temperatures and only along one axis. This also coincides with the refocusing procedures. Therefore, a possible cause of the resulting drift can be a slight tilt of the objective with respect to the axis, with an effective displacement of the image in a lateral direction. Fig. 5(b) and (c) shows the images acquired at 5 K and 300 K, respectively. The total lateral drift up to 300 K and upon refocusing is about 17 µm. Therefore, the displacement over the full range, from base to room temperature is contained in less than one third of the field of view of the microscope.
The results of the measurements of the lateral drift and the corresponding average drift per degree are quantitatively summarized in Table 1 as a function of the sample temperature range.
| Range | Lateral drift | Average Drift/Temperature |
|---|---|---|
| Up to 30 K | negligible (< 53.3 nm) | negligible |
| Up to 60 K | 0.5 µm | 9 nm/K |
| Up to 100 K | 1.5 µm | 16 nm/K |
| Up to 150 K | 3.8 µm | 26 nm/K |
| Up to 200 K | 7.7 µm | 40 nm/K |
| Up to 250 K | 12 µm | 49 nm/K |
| Up to 300 K | 17 µm | 58 nm/K |
Table 1: Lateral drift and average drift per degree as a function of the sample temperature range.
The total drift is astoundingly low at 58 nm/K for the full temperature range from base to room temperature.
Summary
In this paper, we described the lateral stability performance of the attoDRY800 in LT-APO configuration, measured using a wide-field microscope with white light illumination and a test target with calibrated nanopatterns as reference. First, we demonstrated that, within the resolution of our instrument, imaging with an attoDRY800 is not minimally affected by the cryostat operation, since there is no detectable difference within cryo-OFF and cryo-ON images and the image resolution corresponds to the theoretical value of the optics involved. The long-term (more than 40 hours) position stability of setup at base temperature was shown to be better than one pixel size drift (< 53.5 nm), clearly indicating no need for frequent alignment for long-term measurement at same position. We also characterized lateral drift as a function of the sample temperature, it was negligible up to 80 K and total drift was measured to be 17 µm from base temperature to 300 K (58 nm/K in average). This performance is superior to currently-known similar configurations with room temperature objectives (either in vacuum or outside of the cryostat) by about a factor of 20. Hence, our cryogenic objectives in conjunction with the ultra-stable attoDRY800 represent a major leap in stability for any cryo-imaging and cryo-spectroscopy for material science, solid-state physics and quantum optics experiment.
References
[1] http://attocube.com/attomicroscopy/accessoires/lt-apo/